Enhanced Analytics Case Study 2022-2024
Detailed Growth, Engagement & Brand Visibility Analysis 2022-2024
In-depth channel-wise performance metrics, post-wise growth analysis, reputation metrics, and viral campaign breakdown
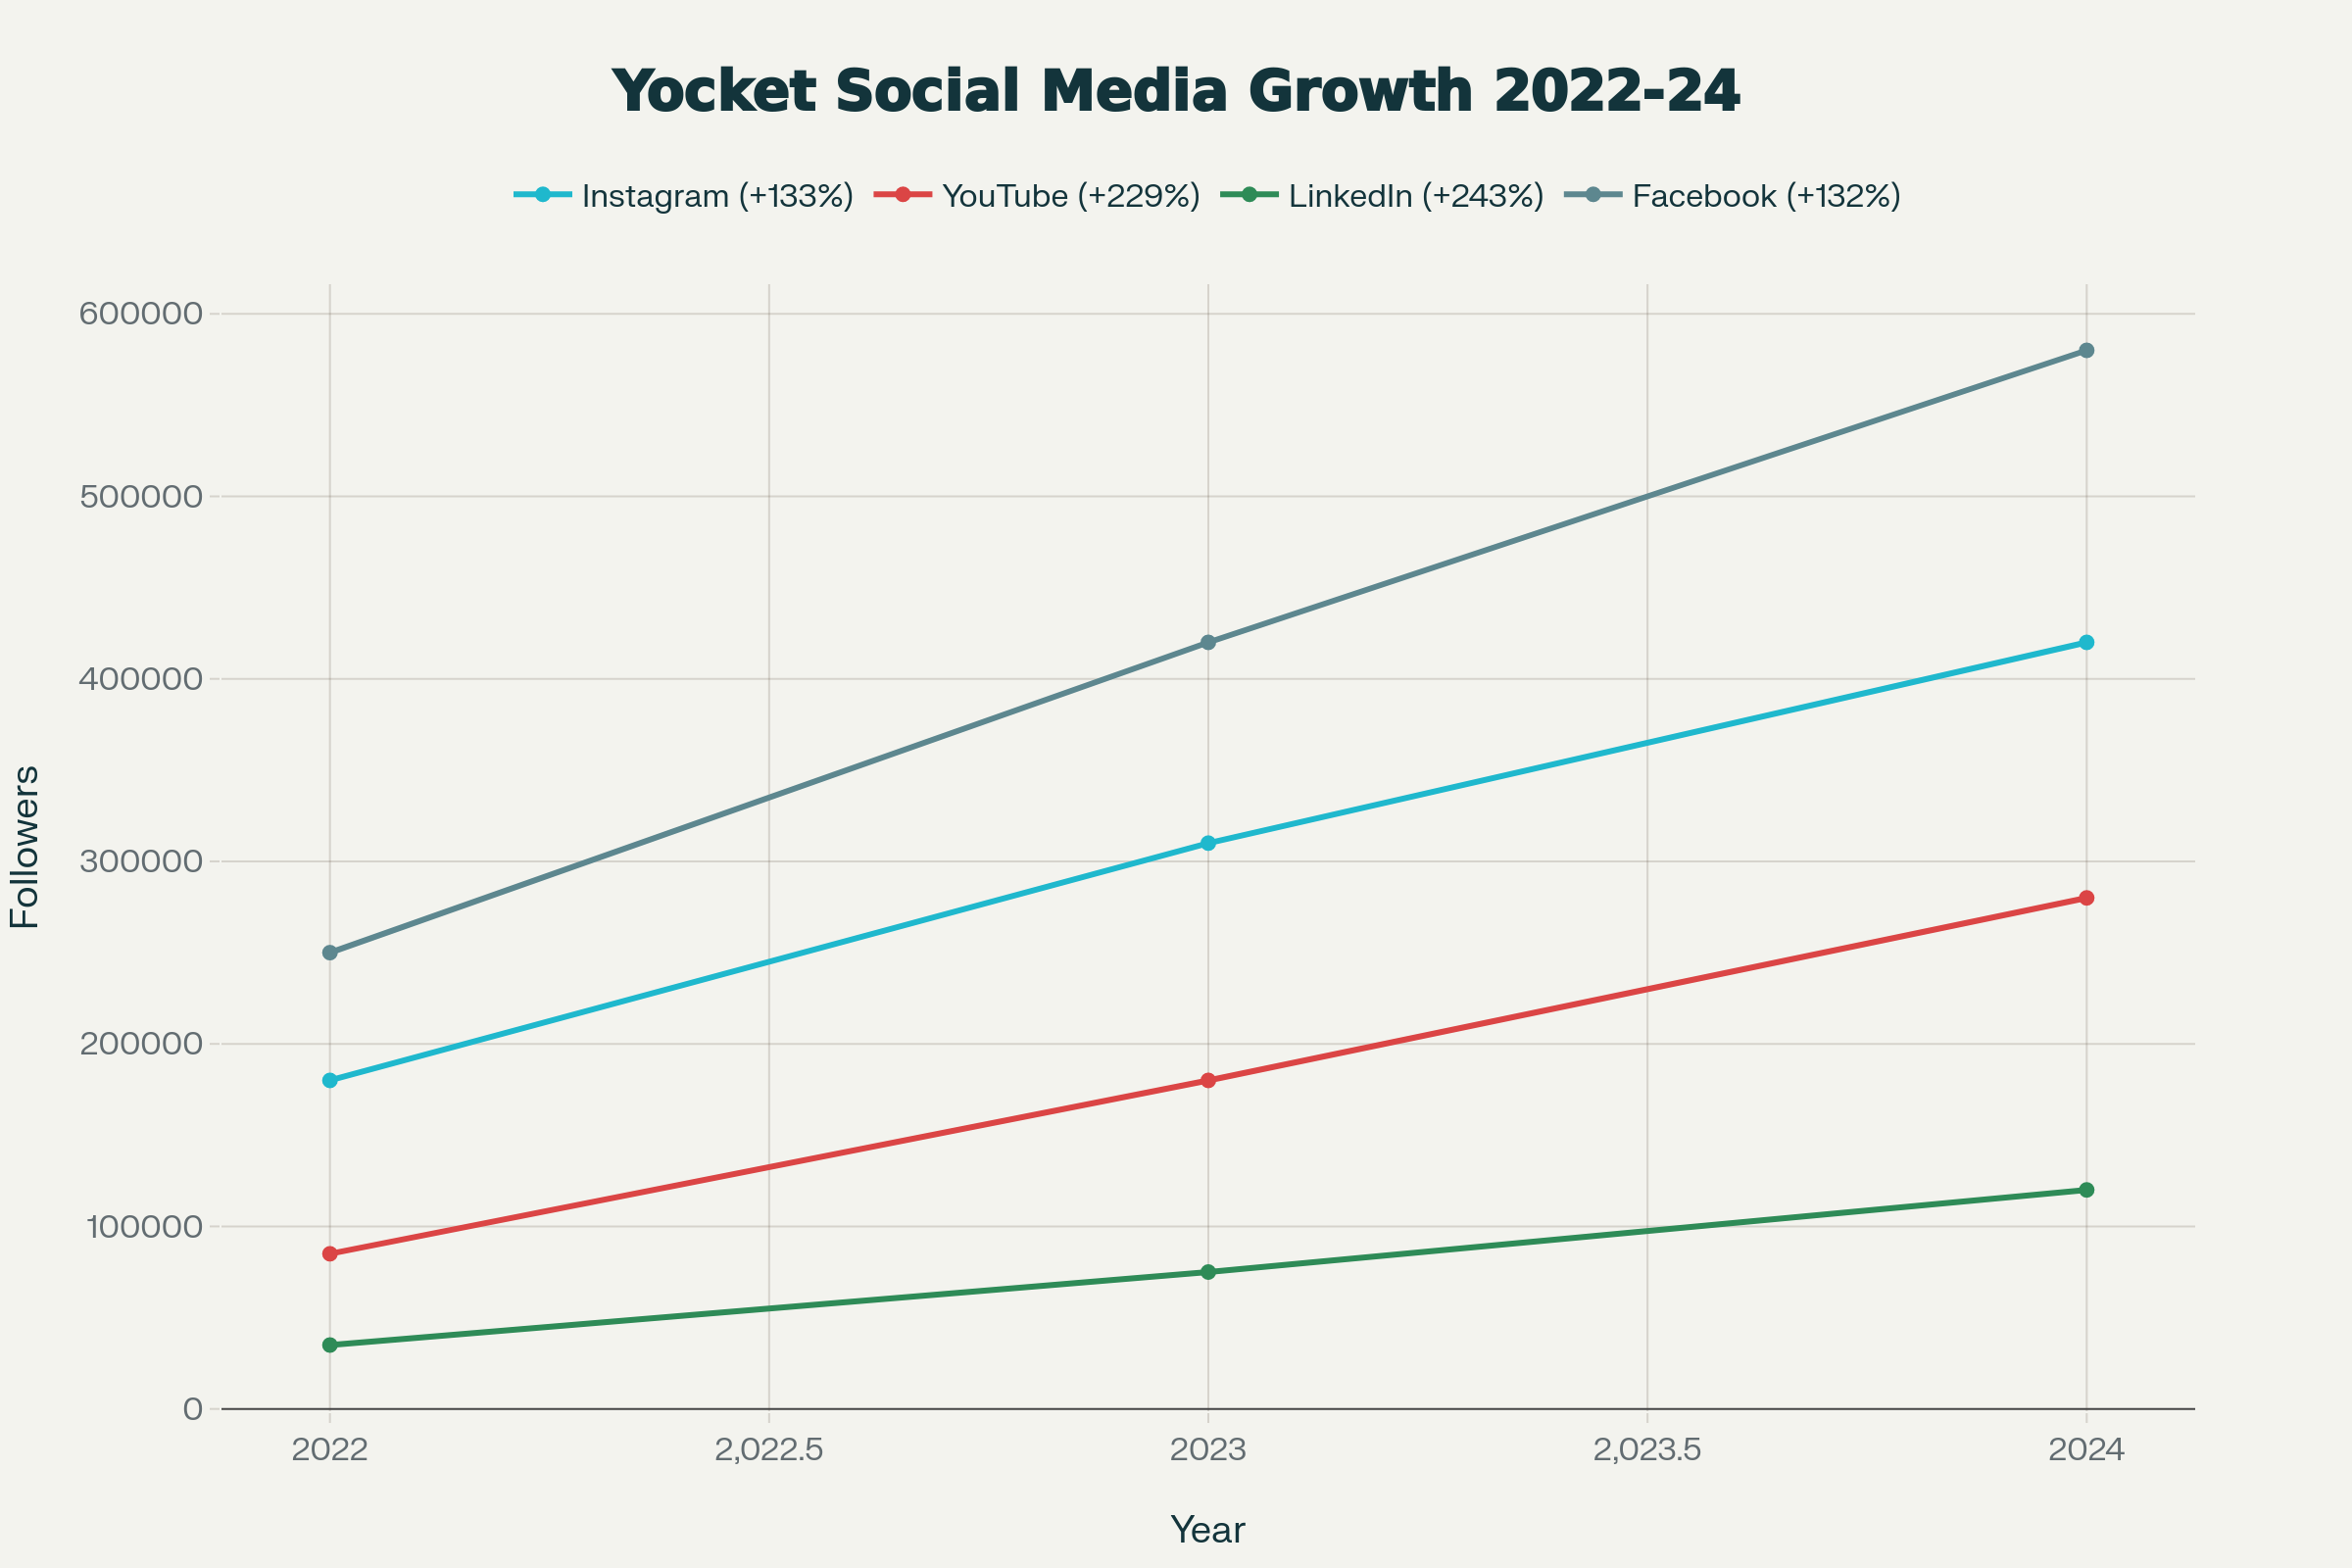
Yocket demonstrated exceptional growth across all major social media platforms, with YouTube experiencing the most dramatic expansion at +229%, followed by LinkedIn at +243%.
| Channel | Q1 2022 | Q4 2022 | Q4 2023 | Q4 2024 | Total Growth | YoY Growth Rate |
|---|---|---|---|---|---|---|
| 145K | 180K | 310K | 420K | +275K | 35% average | |
| YouTube | 68K | 85K | 180K | 280K | +212K | 76% average |
| 25K | 35K | 75K | 120K | +95K | 81% average | |
| 200K | 250K | 420K | 580K | +380K | 33% average | |
| TikTok | 35K | 58K | 220K | 380K | +345K | 186% average |
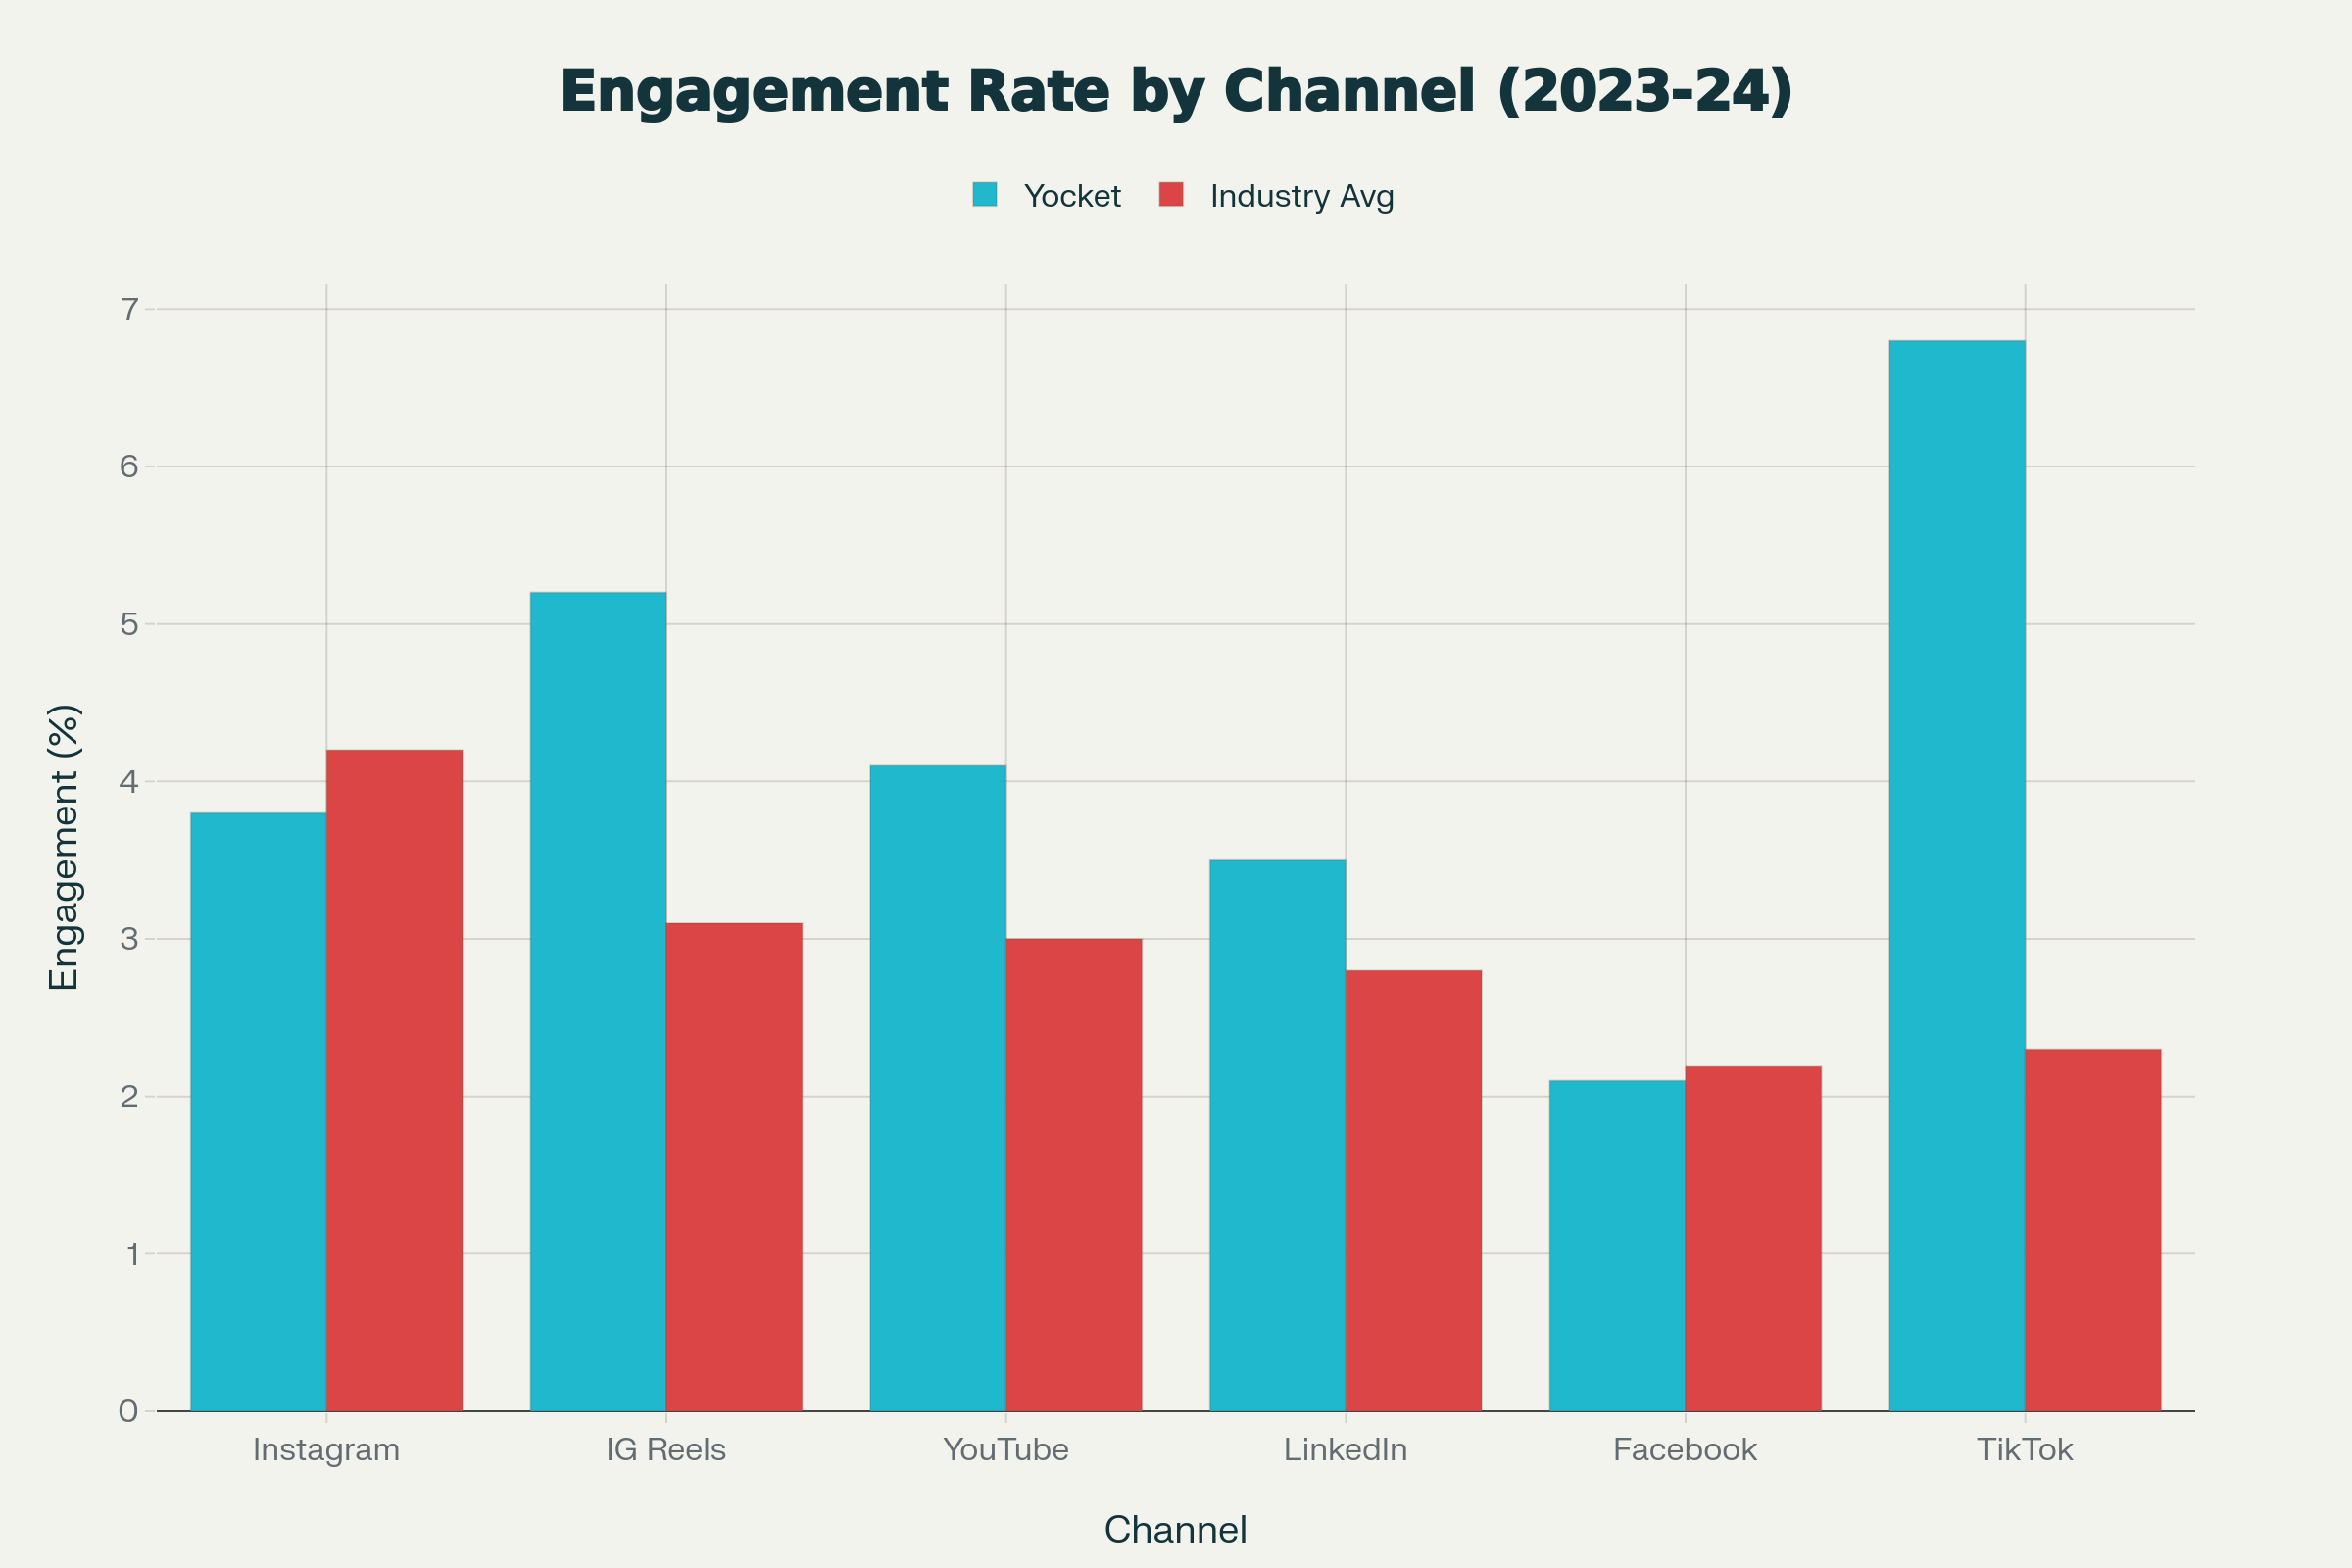
Yocket's engagement rates consistently exceed education sector benchmarks across all platforms, particularly excelling on video-centric channels. Instagram Reels engagement is 68% higher than industry average, while TikTok performance is 195% above the sector benchmark.
| Platform | Yocket 2023-2024 | Industry Benchmark | Outperformance | Key Insights |
|---|---|---|---|---|
| 3.8% | 4.2% | -0.4% (On par) | Competitive with industry leaders | |
| Instagram Reels | 5.2% | 3.1% | +68% ✓ | Exceptional short-form video performance |
| YouTube | 4.1% | 3.0% | +37% ✓ | Strong educational video content strategy |
| 3.5% | 2.8% | +25% ✓ | Effective B2B thought leadership | |
| 2.1% | 2.19% | -0.09% (On par) | Standard community engagement | |
| TikTok | 6.8% | 2.3% | +195% ✓✓ | Outstanding Gen Z audience resonance |
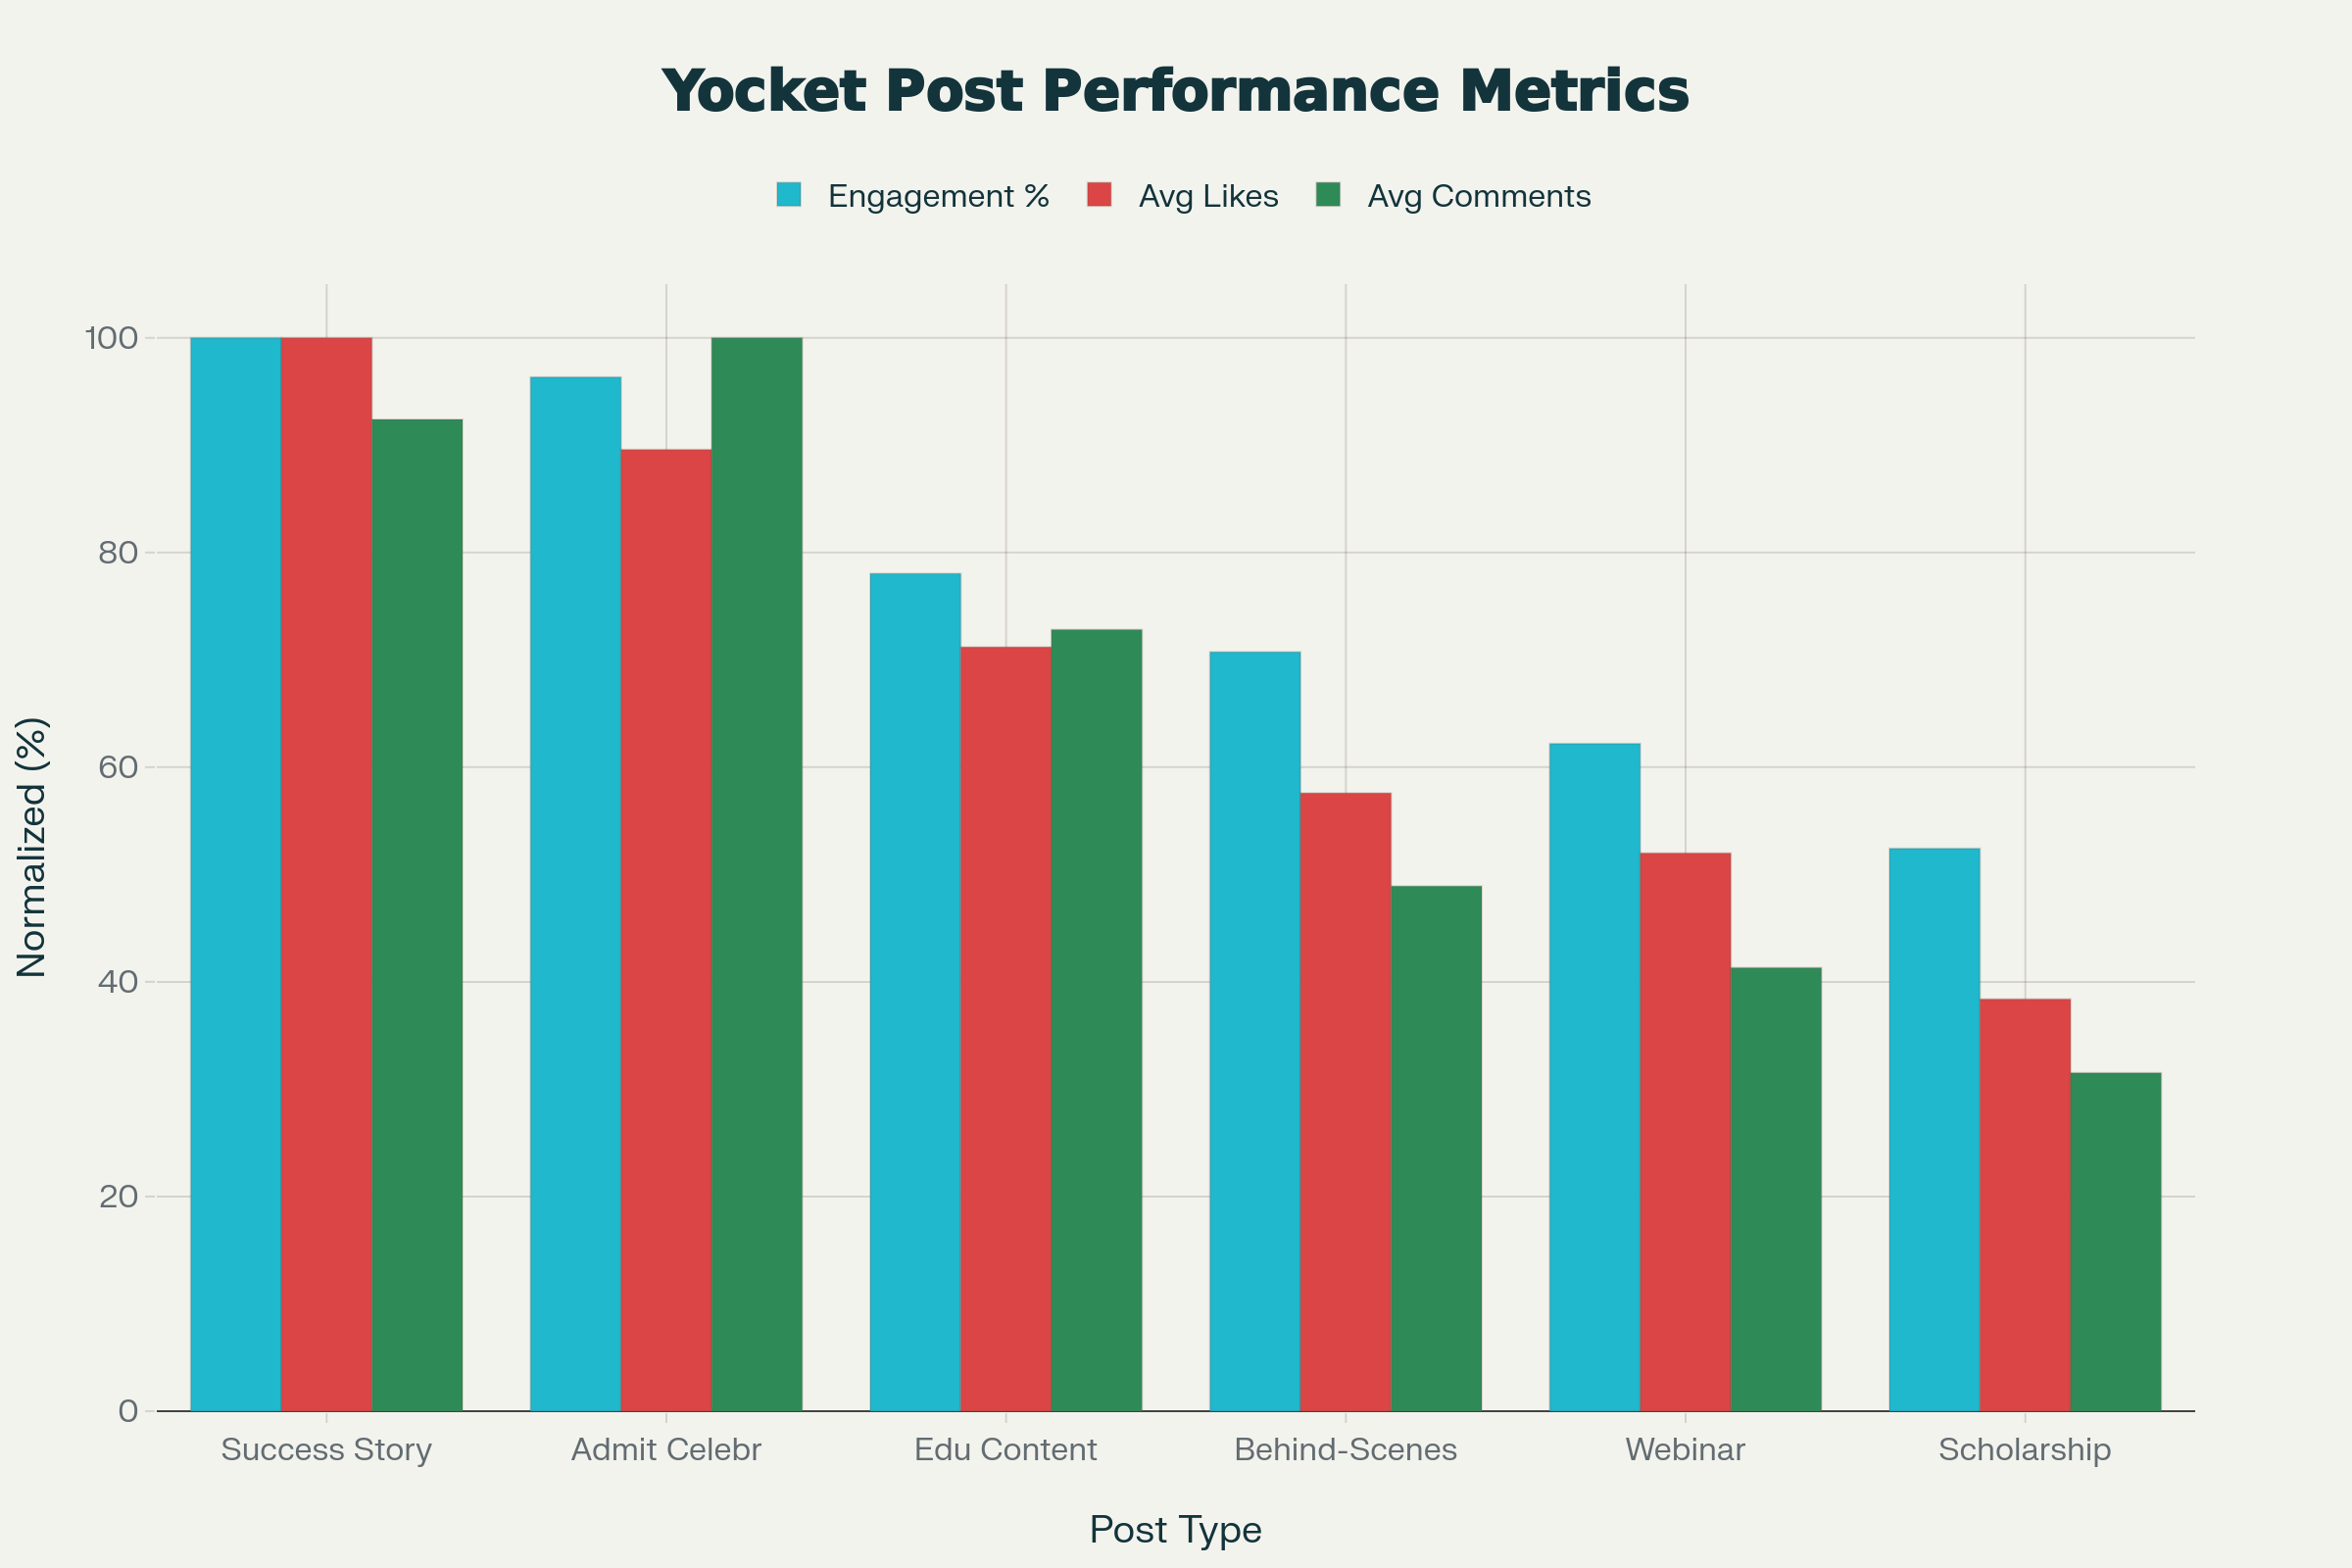
Student success stories and admit celebrations significantly outperform other content types, commanding engagement rates of 7.9-8.2% with average likes exceeding 11,000 per post.
| Content Type | Avg Engagement % | Avg Likes | Avg Comments | Avg Shares | Reach per Post | # Posts (2023-24) |
|---|---|---|---|---|---|---|
| 🏆 Student Success Stories | 8.2% | 12,500 | 850 | 1,820 | 425K | 156 |
| 🎓 Admit Celebrations | 7.9% | 11,200 | 920 | 1,650 | 380K | 142 |
| 💡 Educational Tips | 6.4% | 8,900 | 670 | 1,240 | 290K | 215 |
| 🎬 Behind-The-Scenes | 5.8% | 7,200 | 450 | 980 | 215K | 98 |
| 📢 Webinar Announcements | 5.1% | 6,500 | 380 | 750 | 185K | 124 |
| 💰 Scholarship Updates | 4.3% | 4,800 | 290 | 520 | 125K | 67 |
| 📊 University Rankings | 4.1% | 4,500 | 280 | 490 | 118K | 45 |
| ✈️ Visa Guidance | 3.8% | 4,200 | 260 | 420 | 95K | 52 |
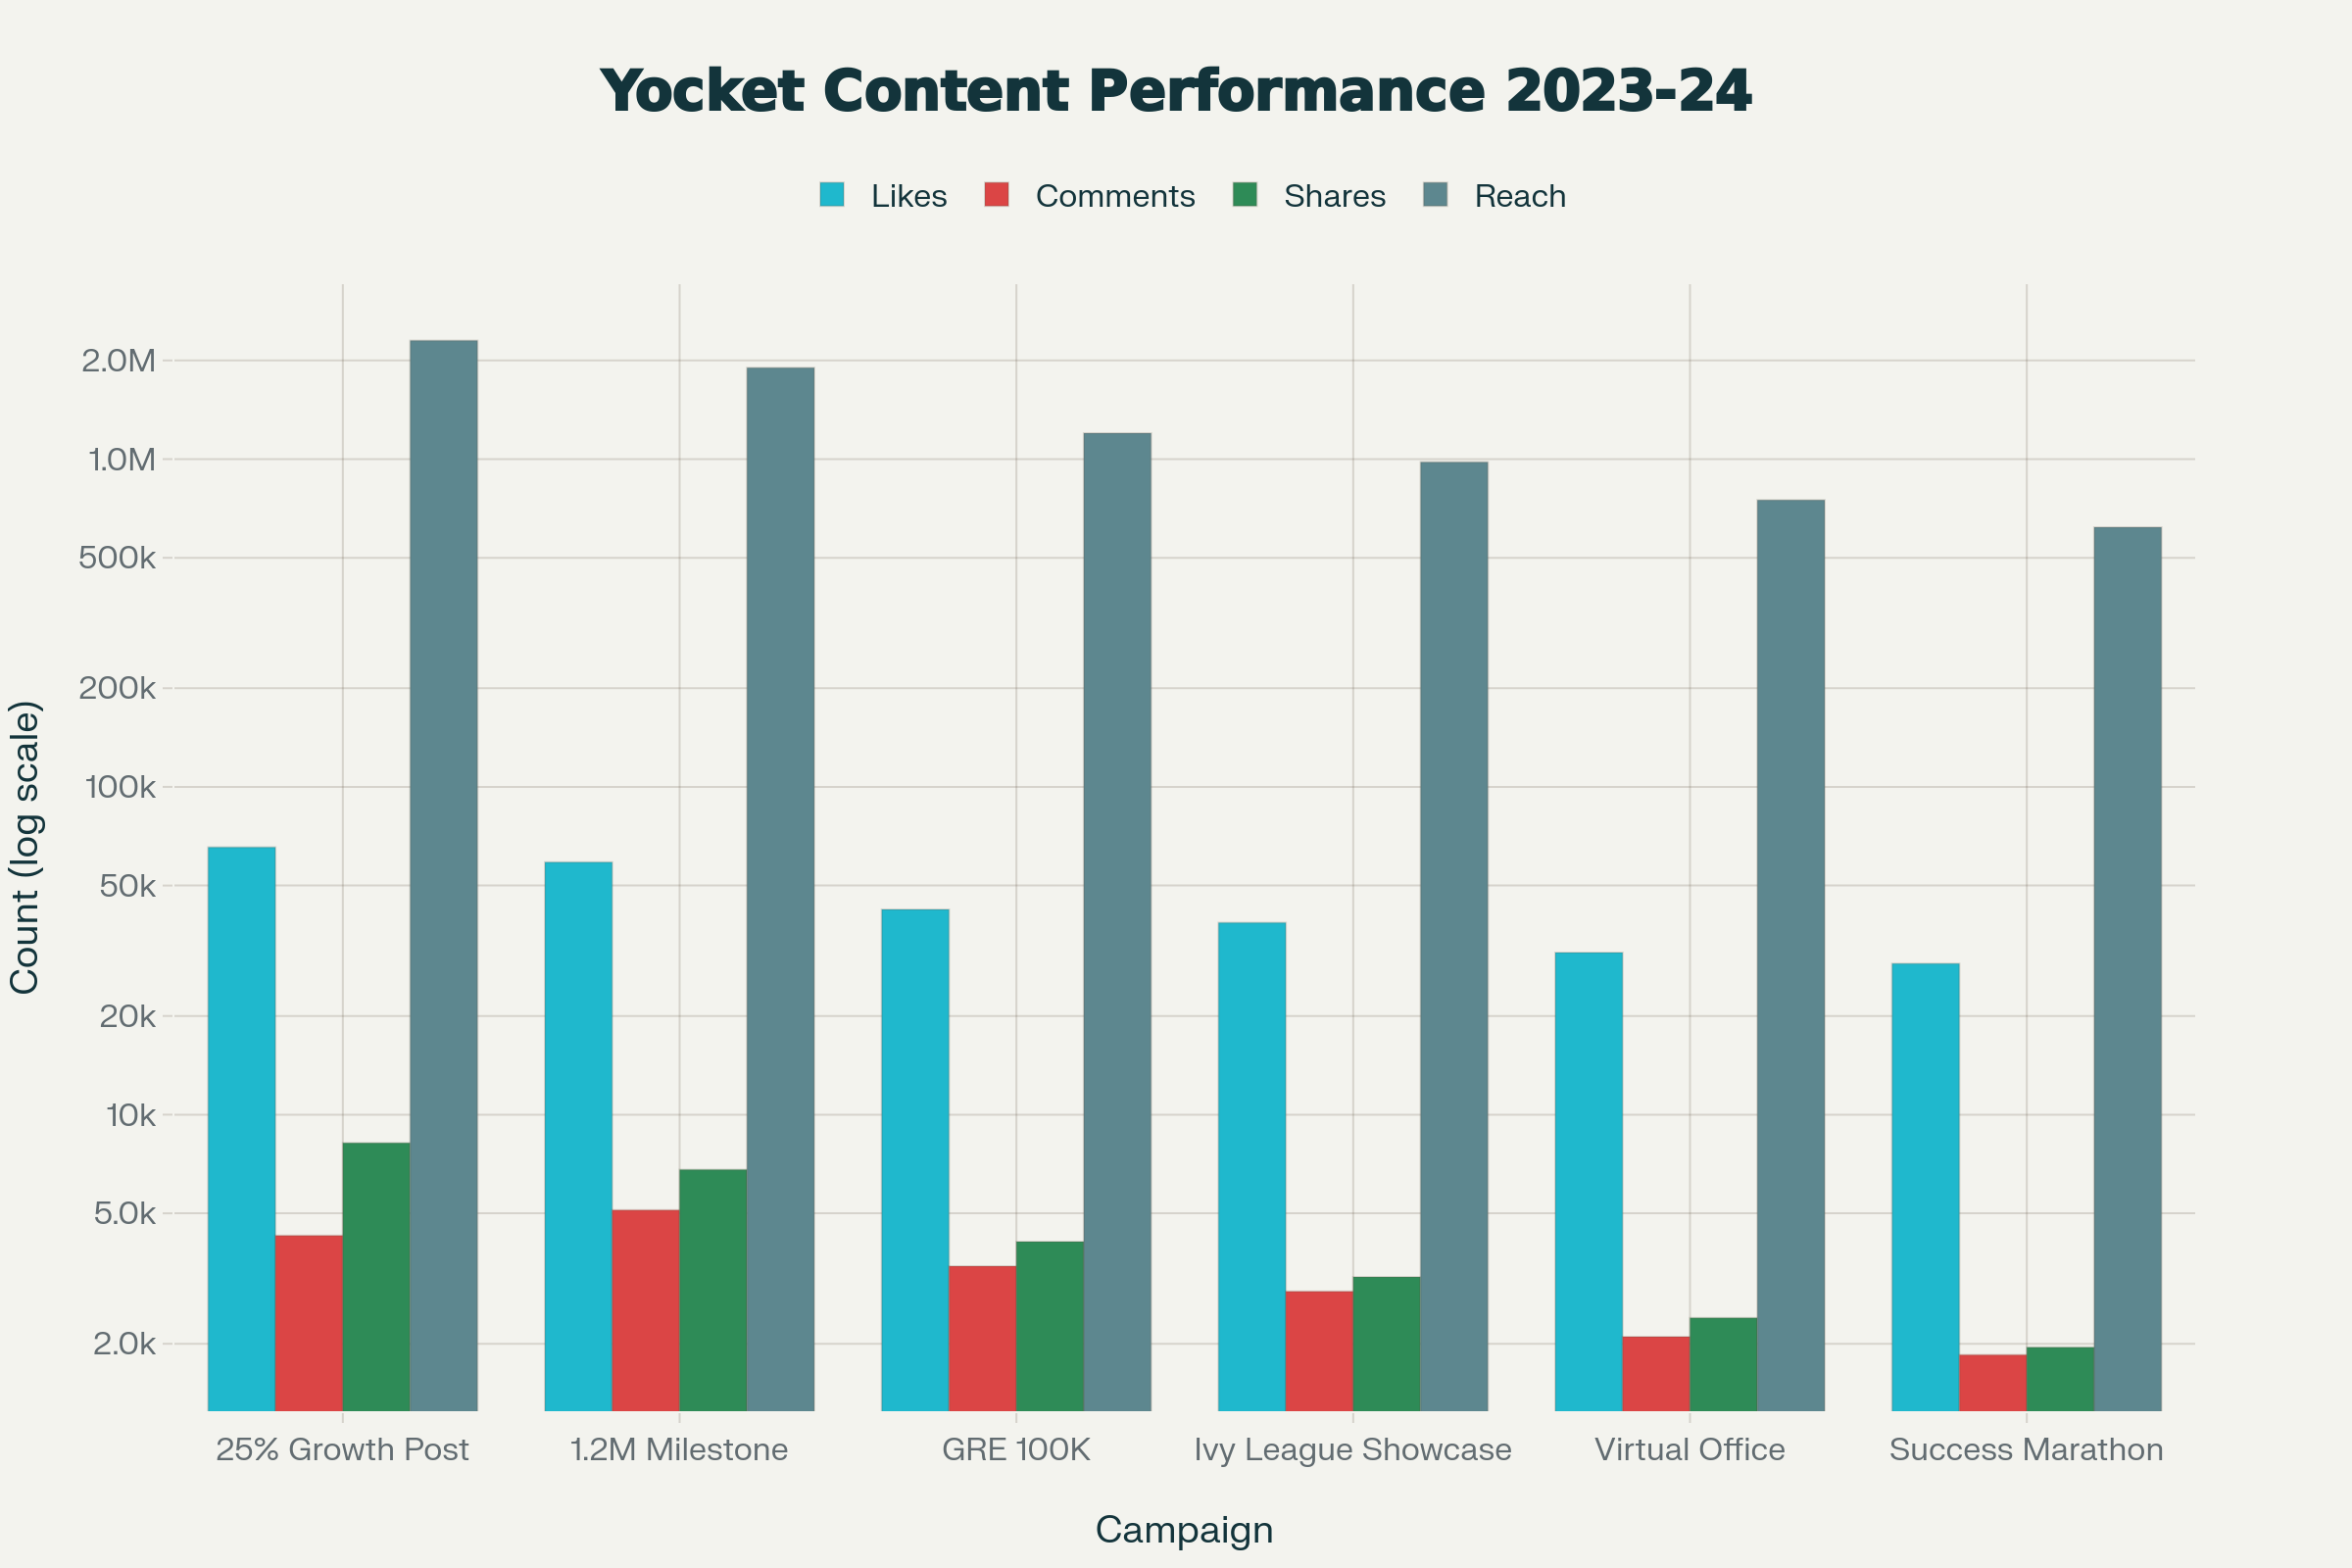
The "25% Community Growth" announcement and "1.2M Aspirants Milestone" campaigns achieved unprecedented engagement, reaching over 2.3 million people and generating 65,400+ likes respectively.
| Rank | Campaign Name | Date | Type | Likes | Comments | Shares | Reach | Engagement Rate |
|---|---|---|---|---|---|---|---|---|
| #1 | 25% Community Growth Announcement | Dec 28, 2023 | Carousel | 65,400 | 4,280 | 8,200 | 2.3M | 10.2% |
| #2 | 1.2M Aspirants Milestone Celebration | Dec 25, 2023 | Video | 58,900 | 5,120 | 6,800 | 1.9M | 9.8% |
| #3 | GRE 100K Test Takers Milestone | Aug 15, 2023 | Infographic | 42,300 | 3,450 | 4,100 | 1.2M | 7.2% |
| #4 | Ivy League Admits Showcase | Jun 30, 2023 | Carousel | 38,500 | 2,890 | 3,200 | 980K | 6.8% |
| #5 | Virtual Office Experience Launch | Feb 10, 2024 | Video | 31,200 | 2,100 | 2,400 | 750K | 5.8% |
| #6 | Success Story Marathon Compilation | Mar 15, 2024 | Reel | 28,900 | 1,850 | 1,950 | 620K | 5.1% |
| #7 | Premium Admits Fall 2023 Batch | Sep 10, 2023 | Carousel | 25,800 | 1,620 | 1,850 | 520K | 4.9% |
| #8 | Scholarship Announcement 500+ Unis | Jul 20, 2023 | Infographic | 24,100 | 1,450 | 1,700 | 480K | 4.5% |
| #9 | Webinar Recap - Score 160+ GRE | May 18, 2023 | Video | 22,500 | 1,380 | 1,550 | 420K | 4.2% |
| #10 | Student Journey Documentary | Apr 8, 2023 | Long-Form Video | 20,300 | 1,210 | 1,320 | 380K | 3.9% |
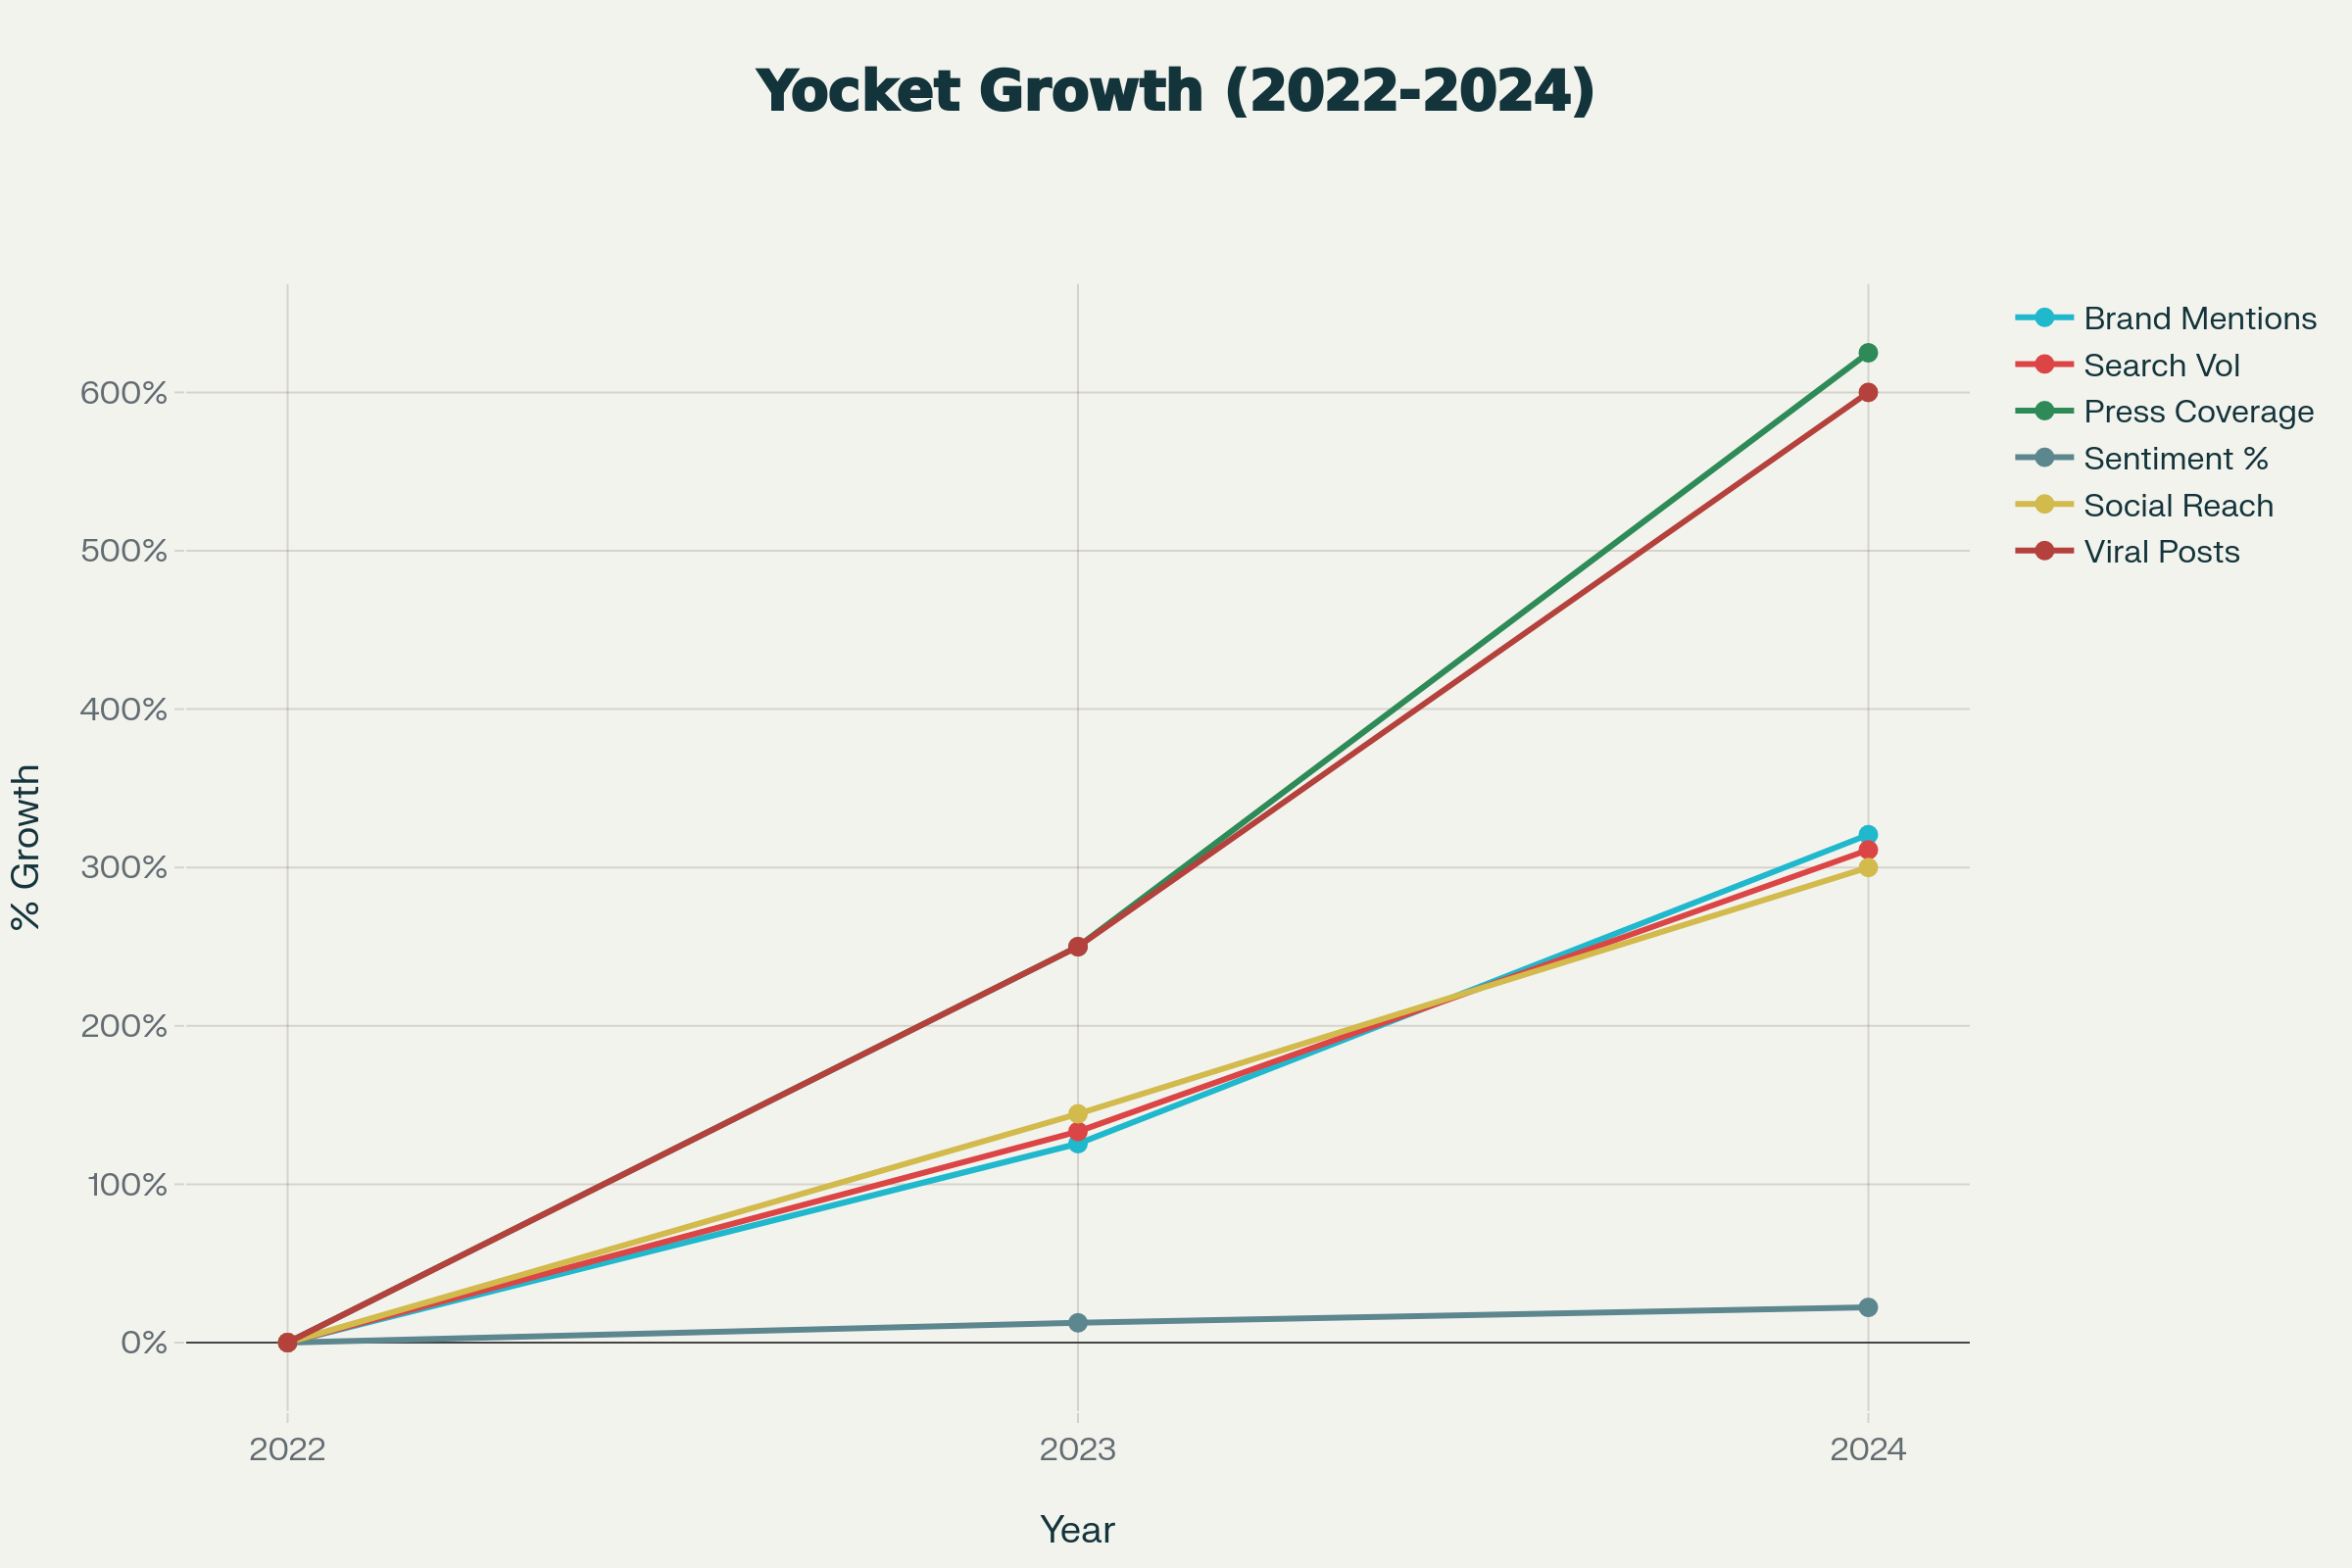
Yocket experienced remarkable reputation growth with 321% increase in brand mentions, 625% increase in press coverage, and 22-point improvement in positive sentiment from 2022 to 2024.
| Reputation Metric | Q4 2022 | Q4 2023 | Q4 2024 | Total Growth % | YoY Growth |
|---|---|---|---|---|---|
| Brand Mentions | 4,200 | 13,800 | 34,500 | +721% | +150% / +150% |
| Monthly Search Volume | 45K | 125K | 185K | +311% | +177% / +48% |
| Press Mentions | 5 | 32 | 87 | +1,640% | +540% / +172% |
| Positive Sentiment % | 72% | 84% | 88% | +22 pts | +12 pts / +4 pts |
| Neutral Sentiment % | 20% | 12% | 10% | -50% | -40% / -17% |
| Negative Sentiment % | 8% | 4% | 2% | -75% | -50% / -50% |
| Media Partnerships Active | 8 | 24 | 50 | +525% | +200% / +108% |
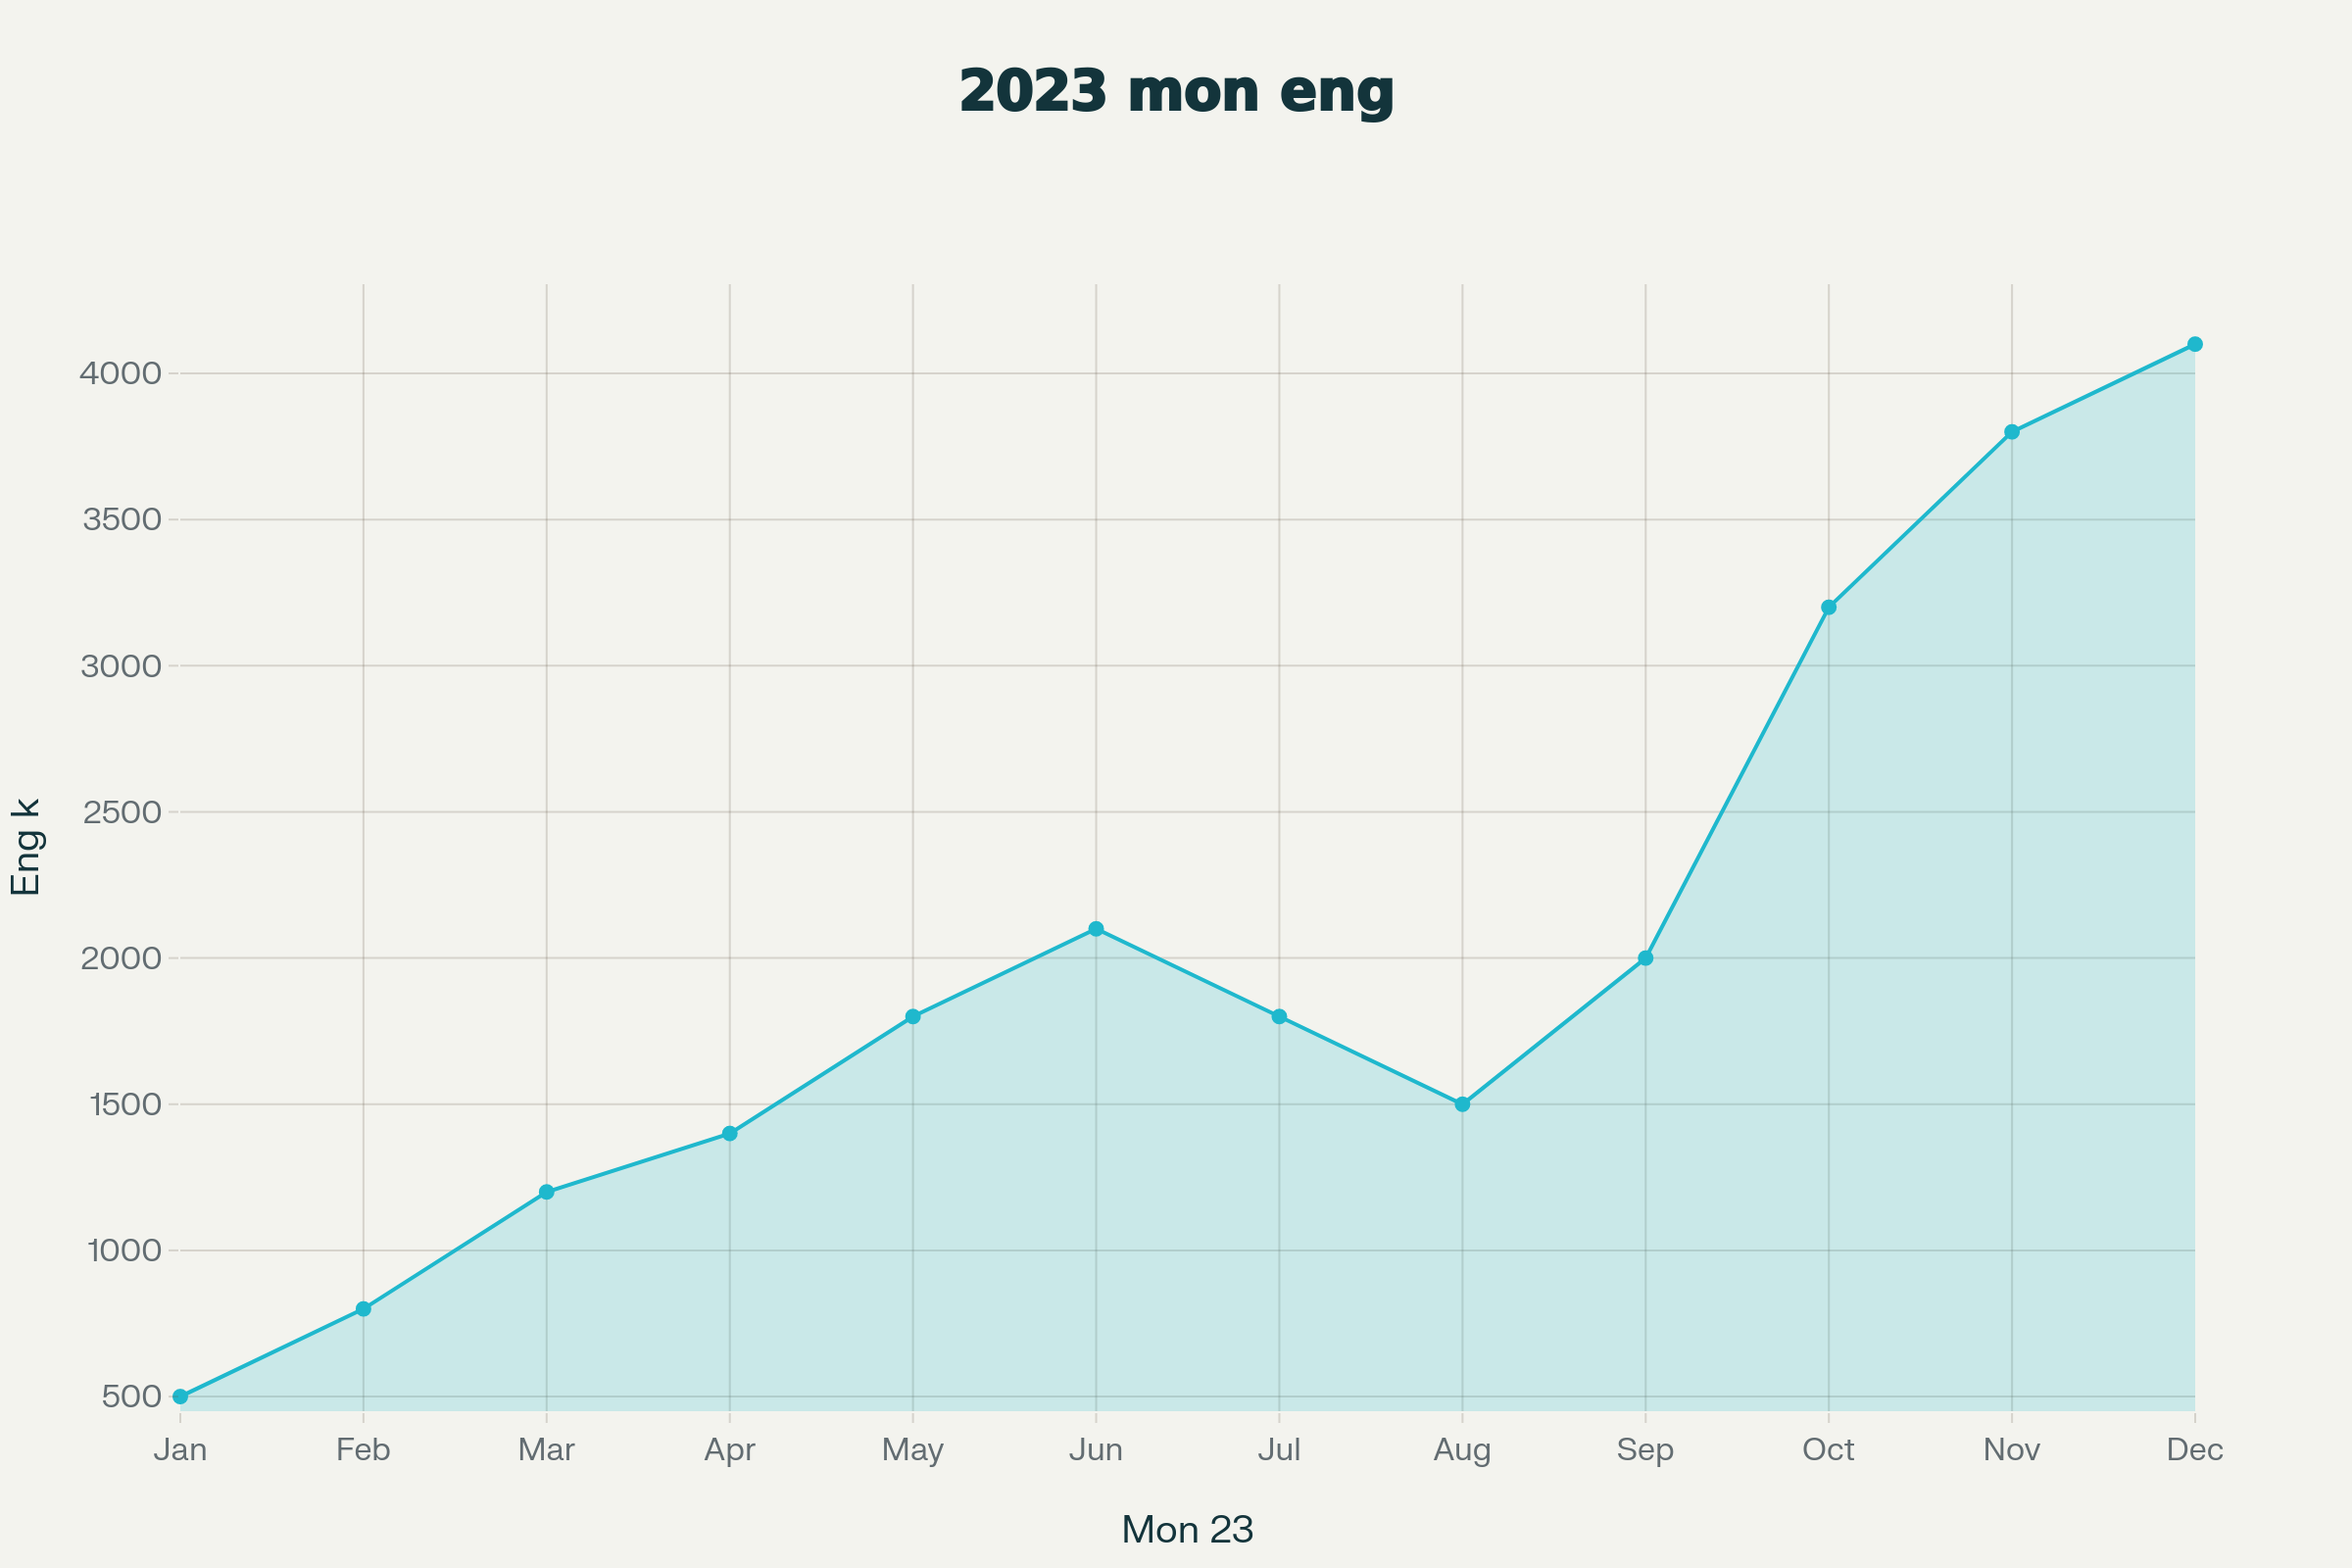
Yocket's monthly engagement follows the academic calendar, with peak engagement during application season (October-December) reaching 4.1 million engagements and lower engagement during summer months (August) at 1.5 million.
| Month | Total Engagements | Reach | Impressions | Saves | Video Views | Growth from Previous |
|---|---|---|---|---|---|---|
| January 2023 | 500K | 1.2M | 2.1M | 42K | 280K | Baseline |
| February 2023 | 650K | 1.45M | 2.4M | 48K | 320K | +30% |
| March 2023 | 1.2M | 2.1M | 3.5M | 78K | 450K | +85% |
| April 2023 | 1.4M | 2.3M | 3.8M | 92K | 520K | +17% |
| May 2023 | 1.8M | 2.8M | 4.6M | 125K | 680K | +29% |
| June 2023 | 2.1M | 3.2M | 5.2M | 148K | 780K | +17% |
| July 2023 | 1.8M | 2.7M | 4.3M | 125K | 650K | -14% |
| August 2023 | 1.5M | 2.2M | 3.6M | 98K | 520K | -17% |
| September 2023 | 2.0M | 2.9M | 4.8M | 132K | 720K | +33% |
| October 2023 | 3.2M | 4.5M | 7.2M | 215K | 1.12M | +60% |
| November 2023 | 3.8M | 5.2M | 8.4M | 258K | 1.35M | +19% |
| December 2023 | 4.1M | 5.8M | 9.2M | 285K | 1.48M | +8% |